 | ||||||
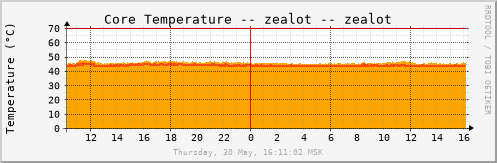
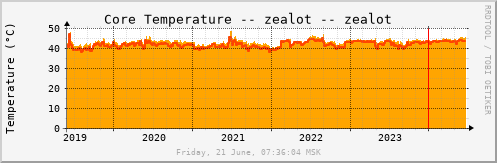
| Core0: | 50.7 °C max | 45.0 °C avg | Core0: 44.8 °C | |||
| Core1: | 49.4 °C max | 44.1 °C avg | Core1: 44.0 °C | |||
|
| ||||||
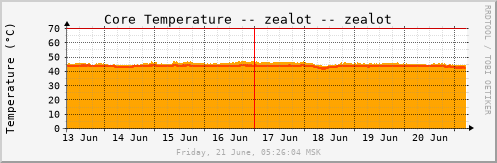
| Core0: | 50.7 °C max | 45.0 °C avg | Core0: 44.8 °C | |||
| Core1: | 49.4 °C max | 44.1 °C avg | Core1: 44.0 °C | |||
 | ||||||
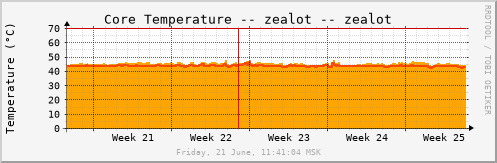
| Core0: | 48.3 °C max | 44.5 °C avg | Core0: 44.9 °C | |||
| Core1: | 46.7 °C max | 43.9 °C avg | Core1: 44.0 °C | |||
 | ||||||
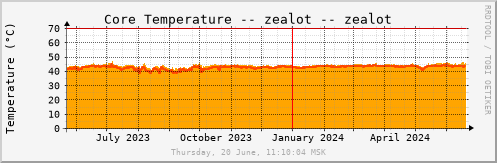
| Core0: | 46.4 °C max | 44.2 °C avg | Core0: 45.0 °C | |||
| Core1: | 45.2 °C max | 43.6 °C avg | Core1: 44.0 °C | |||
 | ||||||
| Core0: | 46.9 °C max | 43.9 °C avg | Core0: 45.1 °C | |||
| Core1: | 45.2 °C max | 43.0 °C avg | Core1: 44.2 °C | |||
 | ||||||
| Core0: | 48.5 °C max | 43.3 °C avg | Core0: 44.5 °C | |||
| Core1: | 47.3 °C max | 42.2 °C avg | Core1: 43.9 °C | |||
| Orange ### | Incoming Traffic in Bytes per Second |
| OrangeRed ### | Outgoing Traffic in Bytes per Second |
|
|
|
|
version 2.17.10 |
Tobias Oetiker <tobi@oetiker.ch> |
and Dave Rand <dlr@bungi.com> |
|
mrtg-rrd.cgi version 1.0 |
Jan "Yenya" Kasprzak <kas@fi.muni.cz> |